Oracle Automatic Workload Repository Survival Guide
Overview
Oracle have provided many performance gathering and reporting tools over the years. Originally the UTLBSTAT/UTLESTAT scripts were used to monitor performance metrics. Oracle8i introduced the STATSPACK functionality which Oracle9i extended. In Oracle 10g STATSPACK has evolved into the Automatic Workload Repository (AWR).
Architecture
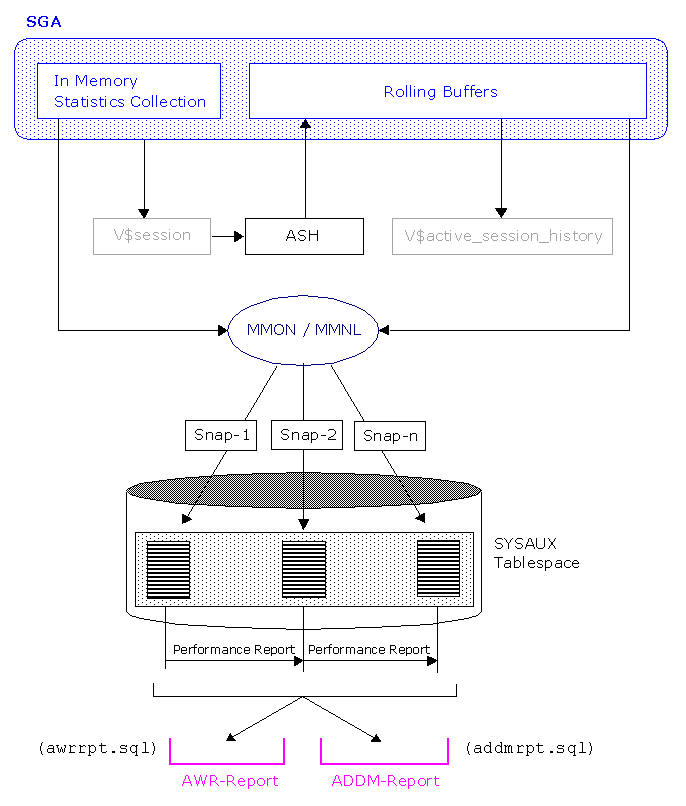
Now let's explore how AWR is designed and structured. Basically, AWR is an Oracle built-in tool that collects performance related statistics from in memory statistics collection. Unlike STATSPACK, snapshots are collected automatically by a new background process called MMON and its slave processes. To save space, the collected data is automatically purged. Both the snapshot frequency and retention time can be modified by the user.
Active Session History (ASH)
ASH samples the current state of all active sessions. This data is collected into memory and can be accessed by
the V$ACTIVE_SESSION_HISTORY view. Active sessions are sampled every second and are stored in a rolling buffer in SGA. Any session that is connected to the database and is waiting for an event that does not belong to the Idle wait class is considered as an active session.Using the script:
sqlplus "sys/password as sysdba"
SQL> @$ORACLE_HOME/rdbms/admin/awrrpt.sqlyou can produce the ASH/AWR Report which is very similar to the STATSPACK Report.
The script prompt you to enter the report format (html or text), the start snapshot id, the end snapshot id and the report filename. The resulting report can be opend in a browser or text editor accordingly.
Specify the Report Type
~~~~~~~~~~~~~~~~~~~~~~~
Would you like an HTML report, or a plain text report?
Enter 'html' for an HTML report, or 'text' for plain text
Defaults to 'html'
Type Specified: html
Specify the number of days of snapshots to choose from
~~~~~~~~~~~~~~~~~~~~~~~~~~~~~~~~~~~~~~~~~~~~~~~~~~~~~~
Entering the number of days (n) will result in the most recent
(n) days of snapshots being listed. Pressing <return> without
specifying a number lists all completed snapshots.
Enter value for num_days:
Listing all Completed Snapshots
Snap
Instance DB Name Snap Id Snap Started Level
------------ ------------ --------- ------------------ -----
MOADB MOADB 10624 12 Aug 2007 23:00 1
10625 13 Aug 2007 01:00 1
10626 13 Aug 2007 03:00 1
10627 13 Aug 2007 05:00 1
10628 13 Aug 2007 07:00 1
10629 13 Aug 2007 09:00 1
10630 13 Aug 2007 10:41 1
10631 13 Aug 2007 12:00 1
10632 13 Aug 2007 13:00 1
10633 13 Aug 2007 14:00 1
10634 13 Aug 2007 15:00 1
Specify the Begin and End Snapshot Ids
~~~~~~~~~~~~~~~~~~~~~~~~~~~~~~~~~~~~~~
Enter value for begin_snap: 10631
Enter value for end_snap: 10634
Automatic Database Diagnostic Monitor (ADDM)
ADDM analysis can be performed over any time period defined by a pair of AWR snapshots taken on a particular instance. Analysis is performed top down, first identifying symptoms and then refining them to reach the root causes of performance problems.
The goal of the analysis is to reduce a single throughput metric called DB time. DB time is the cumulative time spent by the database server in processing user requests. It includes wait time and CPU time of all non-idle user sessions.
Using the script:
sqlplus "sys/password as sysdba"
SQL> $ORACLE_HOME/rdbms/admin/addmrpt.sqlyou can produce the ADDM Report.
Specify the number of days of snapshots to choose from
~~~~~~~~~~~~~~~~~~~~~~~~~~~~~~~~~~~~~~~~~~~~~~~~~~~~~~
Entering the number of days (n) will result in the most recent
(n) days of snapshots being listed. Pressing <return> without
specifying a number lists all completed snapshots.Listing the last 3 days of Completed Snapshots
Snap
Instance DB Name Snap Id Snap Started Level
------------ ------------ --------- ------------------ -----
AKI1 AKI1 10624 12 Aug 2007 23:00 1
10625 13 Aug 2007 01:00 1
10626 13 Aug 2007 03:00 1
10627 13 Aug 2007 05:00 1
10628 13 Aug 2007 07:00 1
10629 13 Aug 2007 09:00 1
10630 13 Aug 2007 10:41 1
10631 13 Aug 2007 12:00 1
10632 13 Aug 2007 13:00 1
10633 13 Aug 2007 14:00 1
10634 13 Aug 2007 15:00 1
Specify the Begin and End Snapshot Ids
~~~~~~~~~~~~~~~~~~~~~~~~~~~~~~~~~~~~~~
Enter value for begin_snap: 10630
Enter value for end_snap: 10634DETAILED ADDM REPORT FOR TASK 'TASK_74989' WITH ID 74989
--------------------------------------------------------
Analysis Period: 13-AUG-2007 from 12:00:03 to 15:00:11
Database ID/Instance: 3849303908/1
Database/Instance Names: AKI1/AKI1
Host Name: AKI1
Database Version: 10.2.0.3.0
Snapshot Range: from 10631 to 10634
Database Time: 15845 seconds
Average Database Load: 1.5 active sessions
~~~~~~~~~~~~~~~~~~~~~~~~~~~~~~~~~~~~~~~~~~~~~~~~~~~~~~~~
FINDING 1: 30% impact (4814 seconds)
------------------------------------
SQL statements consuming significant database time were found.
RECOMMENDATION 1: SQL Tuning, 19% benefit (2992 seconds)
ACTION: Run SQL Tuning Advisor on the SQL statement with SQL_ID
"fgya5px9hrg7b".
RATIONALE: SQL statement with SQL_ID "fgya5px9hrg7b" was executed 281522
times and had an average elapsed time of 0.0058 seconds.
